Why NinjaTrader Cumulative Delta Differs by Bar and Session
Compare Bar and Session cumulative delta on the same futures chart, check how trades are classified, and identify the tick history a Rithmic chart needs.
On this page
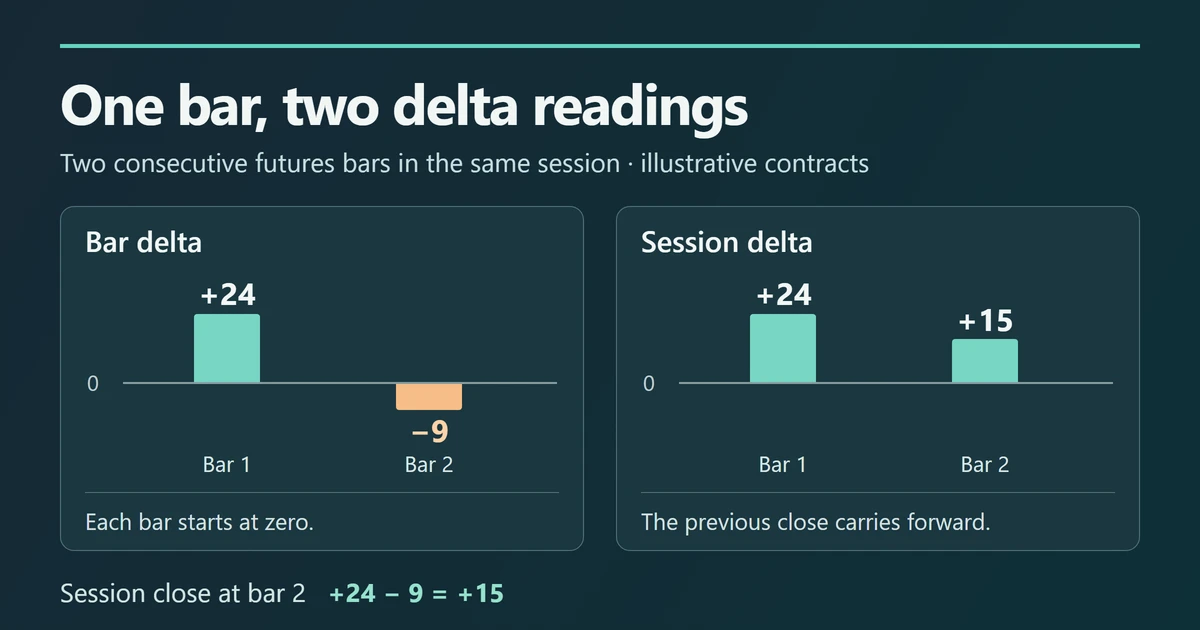
A bar can close at −9 while session cumulative delta closes at +15. Both values can be correct. In NinjaTrader’s Order Flow Cumulative Delta indicator, Bar starts the count at zero with each new bar. Session carries the previous delta close into the next bar of the same trading session. Both measure buy-classified volume minus sell-classified volume. NinjaTrader indicator reference
Compare the same trades in Bar and Session mode
Suppose these are the first two bars of one futures session and the opening bar of the next. The counts are illustrative contracts, with the same trade classification and size filter throughout.
| Trades in this bar | Bar close | Session close |
|---|---|---|
| First bar · 60 buy, 36 sell | +24 | +24 |
| Second bar · 11 buy, 20 sell | −9 | +15 |
| First bar of next session · 17 buy, 23 sell | −6 | −6 |
To check your own panels, subtract the previous Session close from the current one within the same session. On the second bar above, +15 − (+24) = −9. That equals the Bar close. At the next session boundary the count starts over, so use zero as the starting value. The chart’s Trading Hours template defines the session and which trades it includes. Trading Hours templates · Find your chart’s session boundary
Match the settings on both charts
With the futures chart active, press Ctrl+I to open Indicators. Add Order Flow Cumulative Delta from Available, or select the existing instance under Configured. Choose Period for the question you want to answer. To compare Bar with Session, apply two instances to the same contract and bar interval, in separate panels. Keep Delta type and Size filter identical. If the indicator is missing from the list, check Order Flow+ access on your NinjaTrader account. Indicator controls · Order Flow+ access
Bid Ask classifies a trade at or above the ask as buy volume and one at or below the bid as sell volume. A trade inside the spread inherits the previous classification. Up Down Tick uses the change from the previous trade price, carrying the prior classification forward when the price is unchanged. Size filter excludes trades smaller than the threshold. Different settings can produce different totals even for the same bar. Delta type and size filter
For a breakdown by price inside one bar, use a Volumetric footprint chart. To see quantities currently resting at bid and ask levels, open Level II market depth. Cumulative delta measures trades that have already taken place.
Check the tick history on a Rithmic chart
If delta updates live but the earlier Bid Ask values are blank, check the exact contract month, session and dates. Historical Bid Ask needs trade ticks stamped with the bid and ask at the time of each trade. A minute candle can show total traded volume without revealing how those trades were classified. NinjaTrader lists Rithmic as providing bid/ask-stamped ticks. Check the records available for the period you’re comparing. Data by Provider · Inspect historical data in NinjaTrader
Volume bars have one more wrinkle. A single trade can span two volume bars, and NinjaTrader documents that the indicator can assign all of that trade’s volume to the first part of the split. If a mismatch appears on volume bars, compare the same period on minute bars to isolate that effect. Volume-bar behavior
PropFirmConnector connects any Rithmic account to NinjaTrader 8. If the account itself is missing, use the connection guides. Once the account is connected, Order Flow+ access and the historical ticks available for the chosen contract determine what the indicator can display.
Documentation reviewed November 22, 2026.
PropFirmConnector publishes this article and sells the Rithmic connection add-on described on this site.