NinjaTrader Tick Charts vs Time Charts for Rithmic Data
Set up NinjaTrader tick charts, compare trade-count and minute bars, and check session boundaries, historical data and the separate Tick Replay setting.
On this page
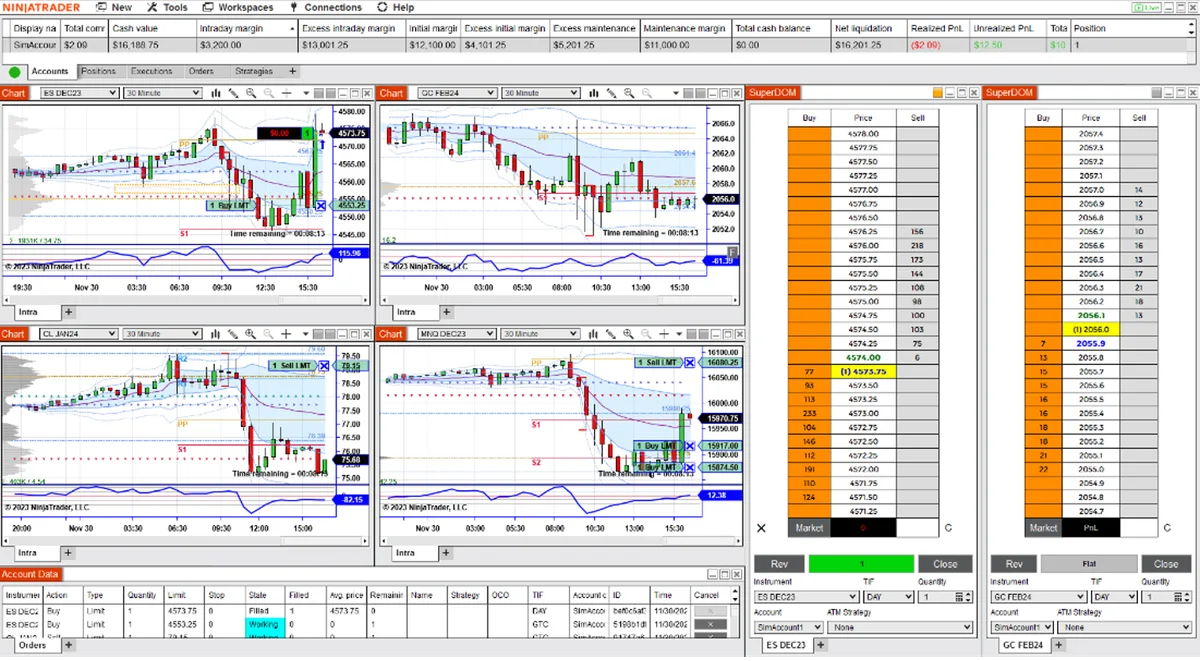
A NinjaTrader tick chart groups trades into bars; a minute chart groups data by time. Choose the interval around what you need to inspect, then keep the instrument, session and data settings consistent when comparing charts.
What a tick bar counts
NinjaTrader’s Bar Types reference distinguishes a trade tick from a price increment. In a Last-price tick series, trades can count toward the bar even when the price stays unchanged.
| Bar type | What determines its size | What can vary |
|---|---|---|
| Tick | Number of trade ticks, such as 500 | Elapsed time, contract volume and price range |
| Minute | A clock interval, such as one minute | Number of trades, volume and price range |
| Volume | Number of units traded | Number of trades and elapsed time |
| Range | Price movement measured in the instrument’s minimum increments | Number of trades and elapsed time |
A 500-tick bar does not mean 500 contracts or 500 minimum price movements. One trade can contain more than one contract. Tick bars can form quickly during active periods and slowly during quiet periods; there is no fixed conversion between a 500-tick chart and a one-minute chart.
The numbers here illustrate settings, not a recommended trading interval.
Set up a tick chart
Use NinjaTrader’s Data Series window:
- Open Control Center > New > Chart, or right-click an existing chart and select Data Series.
- Choose the instrument, including the futures contract month. On an existing chart, select the intended series under Applied.
- Set Price based on to Last, Type to Tick, and Value to the desired count.
- Inspect Trading Hours, Break at EOD and the historical range under Load data based on.
- Apply the settings. For comparison, open another chart of the same contract with Type: Minute.
A saved Chart Template can override manually configured settings. Recheck the series after applying one. For a chart with several series, make sure you edited the intended series rather than another instrument’s settings.
Compare the same session and starting point
Use a separate chart for the comparison so your original view remains available. Hold the contract, session and date range constant while changing the bar type. This makes it easier to identify which change caused the difference.
Break at EOD can leave the final bar short of its normal count. NinjaTrader’s end-of-day reference explains how this setting ends a bar at the session boundary or allows it to continue until complete. It also affects the starting point for the following bars and calculations.
Check the Trading Hours guide when two charts include different session periods. If their contract months differ, use the futures rollover guide before comparing their shapes.
Tick charts and Tick Replay have different jobs
Choosing Type: Tick defines bar construction. Tick Replay is a separate option for historical processing by indicators and strategies designed to use it. It is not required merely to choose a tick interval.
NinjaTrader’s Tick Replay reference warns that it uses additional resources and is not a way to reproduce live strategy fills in backtests. Enable it for a specific script requirement rather than as a general chart improvement.
For practicing order entry against a recorded session, follow the Market Replay and Playback101 guide. That is another separate task.
When bars are missing or look different
NinjaTrader builds tick bars from tick data. Its bar-building reference explains why provider data, timestamps, session settings and the loaded date range can affect the result. Reloading historical data can also change bars previously built in real time.
If a specific date is blank, inspect the saved Tick records for that contract before reloading the chart.
| Observation | Useful first check |
|---|---|
| Minute history loads but tick history does not | Check tick-data availability for the instrument and requested period. Minute bars cannot supply the missing trade sequence. |
| Another trader’s chart looks different | Compare contract, interval, session, date range and data provider before changing settings. |
| Bars differ after a historical reload | Record the original settings and compare the historical source; a changed shape alone does not establish a connection fault. |
For orders placed from a chart, inspect the selected account and instrument using the Chart Trader guide. Changing bar construction does not choose the destination account.
PropFirmConnector connects any Rithmic account to NinjaTrader 8. Use the connection directory for the connection step. PropFirmConnector supplies connections; NinjaTrader builds the charts, and trade copying requires a separate copier.
Documentation reviewed October 31, 2026. The workspace image is illustrative, not a tick-chart comparison or evidence of an account or execution-quality test.
PropFirmConnector publishes this article and sells the Rithmic connection add-on described on this site.