Build a Futures Watchlist with NinjaTrader Market Analyzer
Set up NinjaTrader Market Analyzer rows and columns, check hidden instruments and indicator settings, and distinguish market quotes from account positions.
On this page
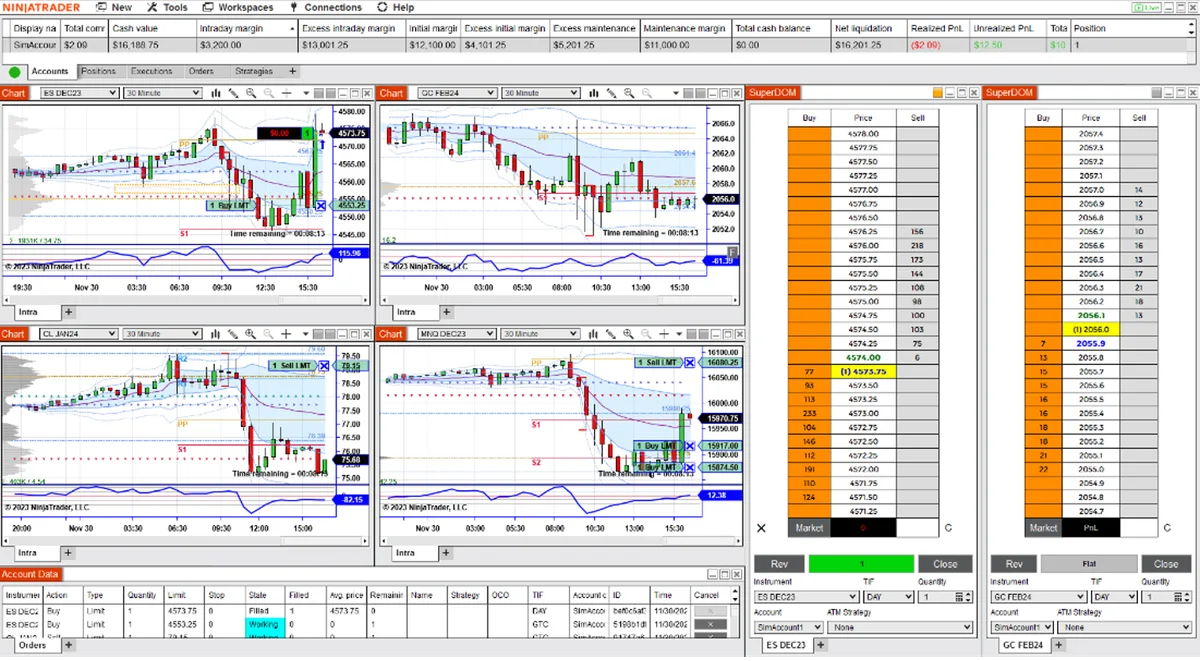
Open Control Center > New > Market Analyzer to build a table of instruments, quotes and indicator values. Start with a few futures contracts and the columns you actually need. Adding an instrument to the table does not mean an account holds a position in it.
NinjaTrader describes Market Analyzer as a customizable quote sheet for monitoring multiple instruments. It can also display position information. The meaning of a number depends on its column and configuration.
Build the watchlist in two passes
Configure columns first, then add instruments. NinjaTrader recommends this order because changing columns after loading instruments can require historical data to reload.
- Right-click inside Market Analyzer and select Columns.
- Select a column from the available list, choose Add, and review its parameters on the right. Begin with the price information you want to compare; add indicators afterward.
- Select OK, then right-click the table and choose Add Instrument(s). Select an individual contract or an instrument list; Select All adds the instruments from a list.
- Confirm the contract month on every futures row. Use the futures rollover guide when moving the watchlist to a new expiry.
The columns reference explains the available configuration controls. The instrument-row guide covers adding, editing and removing rows.
Use label rows to separate groups you want to compare. You can drag rows into a useful order or select Create Instrument List from the right-click menu to save the current instruments for other instrument selectors.
Read each column in its own context
| Information | What to verify |
|---|---|
| Quotes | The instrument and contract month, plus whether the connected feed supplies current data. |
| Indicator value | The selected indicator and plot, input data, bar type, interval and Trading Hours settings. |
| Position or PnL information | The column’s configuration and the corresponding account position; a quote row alone proves neither ownership nor an executed order. |
For an Indicator column, select the indicator and the plot to display. Inspect its Data Series, Time Frame and Calculate settings before comparing it with a chart. A chart and a Market Analyzer column can use different inputs or intervals even when their instrument names match. The tick-versus-time chart guide explains bar types; the Trading Hours guide covers session boundaries.
For actual holdings, open the Control Center’s Positions tab. It displays open positions with instrument, side, quantity, account display name and connection. Inspect Filter By Account and the account identifiers when reconciling a watchlist value with a position. Do not use a moving quote or colored cell as evidence that a copied order reached another account.
Sort values without losing track of instruments
Click a column header to choose ascending or descending order. To keep rows ranked as values change, enable Auto Sort from the right-click menu; its interval is configured in Properties. NinjaTrader documents this in Dynamic Ranking and Sorting.
Watch the instrument label when rows move. With label groups, instruments sort within their group. If you are inspecting one row closely, consider leaving automatic sorting off until you finish.
Cell conditions change a cell’s appearance or text. Filter conditions hide rows. These are different display behaviors, described in NinjaTrader’s conditions guide. If a contract seems to disappear, check Row Filter and the column’s conditions before adding another copy. A hidden row does not close a position.
For a sound or message when a value meets a rule, configure a NinjaTrader alert. Alert conditions and rearm settings serve a different purpose from cell colors and hidden rows.
Keep loading and refresh work manageable
More instruments, indicator columns and historical bars increase the work needed to populate the table. NinjaTrader’s performance guidance also identifies frequent sorting and tick-by-tick indicator calculations as additional processing work.
Add instruments and indicators gradually. Load the history the indicator needs, and choose its calculation mode deliberately. On bar close and On each tick answer different timing needs; changing the setting can change when a displayed indicator updates. Do not interpret every unchanged indicator cell as a failed connection.
If quotes are absent across the workspace, use the Rithmic login and blank-chart checks. If the question concerns quantities at multiple prices rather than a watchlist, use the Level II guide.
Keep connections and copied orders separate
PropFirmConnector connects any Rithmic account to NinjaTrader 8. The connection directory provides setup walkthroughs; it is not an eligibility list.
PropFirmConnector supplies connections. A separate trade copier controls copying, and the receiving account’s orders and positions need their own verification. Market Analyzer is useful for scanning instruments, but its quote display is not a copier delivery receipt.
Once the watchlist is useful, include it in your workspace backup checklist so you can compare instruments and column settings after a move.
Documentation reviewed November 1, 2026. The workspace artwork is illustrative, not a Market Analyzer screenshot or evidence of a live-account test.
PropFirmConnector publishes this article and sells the Rithmic connection add-on described on this site.